Просмотр новости
Найдите то, что Вас интересует
 Спутники
 РН
РН SpaceX
 Роскосмос
 NASA
NASA
СпутникиРНSpaceXРоскосмосNASAET drew up a longlist of more than five dozen indicators across all key themes of the economy— from the external sector and markets to farm health and jobs. We then applied one filter to each to narrow it down: does an indicator say something that others don’t already say?
Synopsis
ET drew up a longlist of more than five dozen indicators across all key themes of the economy— from the external sector and markets to farm health and jobs. We then applied one filter to each to narrow it down: does an indicator say something that others don’t already say?
Listen to this article in summarized format
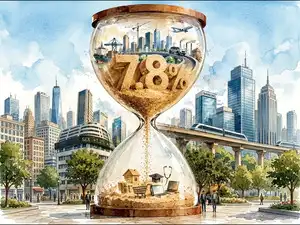
The announcement of a stellar showing by the Indian economy in the first quarter, with growth coming in at 7.8%, sparked intense debate. While many said this had been borne out by upbeat, high-frequency proxy datasets, others said the gains were not being felt on the ground. ET speaks with economists and looks at the trajectory of a wide range of macroeconomic indicators to decode the puzzle: how well is the economy doing, really?
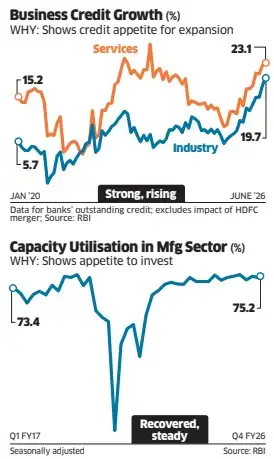
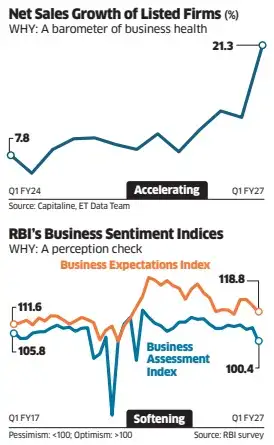
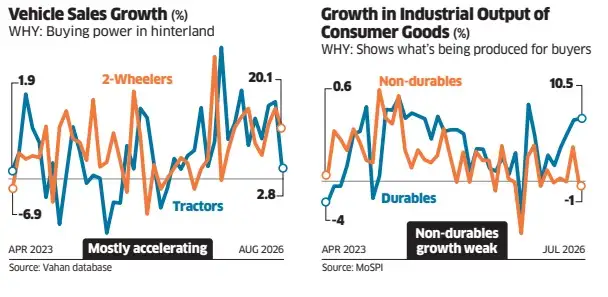
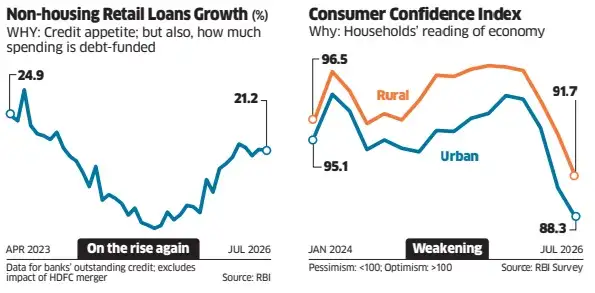
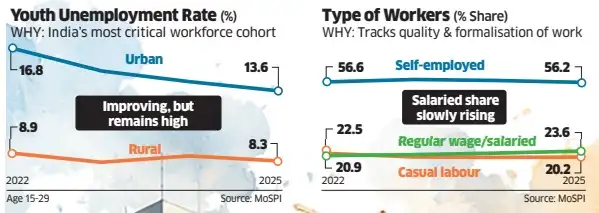
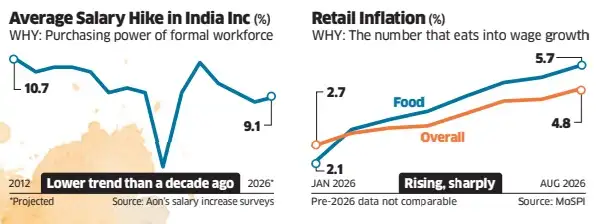
HOW WE CHOSE THE INDICATORS:The Indian economy has many moving parts, and indicators that track them come in myriad forms. ET drew up a longlist of more than five dozen indicators across all key themes of the economy— from the external sector and markets to farm health and jobs. We then applied one filter to each to narrow it down: does an indicator say something that others don’t already say? Where a single number masks more than it reveals, we went a level deeper, e.g., we favoured some subindices over well-known indices. Each segment had to tell a complete story—consumption, for example, was paired with credit to flag if spending is debt-led. No such curation can ever be perfect, but the final list has 20 indicators across five segments. The choice of timeframe for each chart was dictated by indicator-specific needs and limitations in data availability and comparability.
Industry and business activity
 ET Bureau
 ET Bureau
Consumption & Demand
 ET Bureau
 ET Bureau
Employment, job quality & wages
 ET Bureau
 ET Bureau
We don’t feel the GDP growth on the ground because the statistics ministry’s estimates come in a long series. We start with the first estimate (e.g. 7.8% for Q1, released on August 31) and then these estimates are revised multiple times as more data comes in. You get the final estimates only after two years. Therefore, people get confused. What this means is that 7.8% is not the final number.
The GDP estimates are a lot more than just the aggregation of the high-frequency data. They bring in all sorts of other things and in certain cases, that data set has been improved a lot. For instance, we have the Periodic Labour Force Survey for quite some time as an input to the GDP estimation process. The new one on the block is the Annual Survey of Unincorporated Sector Enterprises (ASUSE), also conducted by the Ministry of Statistics and Programme Implementation. It is not high-frequency because it is an annual report, but it gives you a realistic measure of what is happening in the unorganised sector. This is a dataset that really needs to be tracked because in the corporate sector for which we get data regularly, things are much more stable. ASUSE data is more expansive than the corporate bit.
On the consumption side, we usually don’t have an independent measure of this indicator. If you are really looking at something like the cost of living, you still need to look at the consumer price index (CPI). If you are looking at the cost of production, you would look at the wholesale price index (WPI). If you’re looking at how much the producers are getting, then you will look at the producer price index (PPI). One can do combinations of these to infer other things as well. The high-frequency indicators have not changed much.
**Data, charts, text and reporting by TANAY SUKUMAR, ANOUSHKA SAWHNEY, KIRTIKA SUNEJA; Design: SAMIR KUMAR
( Originally published on Sep 20, 2026 )
Read More News on
| # | Наименование новости | Тональность | Информативность | Дата публикации |
|---|---|---|---|---|
| 1 | India's new GDP series: GST, corporate data drive new methodology | 0 | 6.9 | 21-09-2026 |
| 2 | GDP more than aggregation of high-frequency indicators: Pronab Sen, India’s first chief statistician | 0 | 8.36 | 20-09-2026 |
| 3 | Economic data, commodities and markets | 0 | 5 | 25-06-2026 |
| 4 | Economic data, commodities and markets | 0 | 5 | 18-06-2026 |
| 5 | Economic data, commodities and markets | 0 | 5 | 04-06-2026 |
| 6 | Названы главные причины роста российской экономики | 0 | 10 | 12-08-2026 |
| 7 | The dying days of the Fed’s dot plot | 0 | 8.52 | 22-09-2026 |
| 8 | Решетников: темпы роста ВВП РФ за два года превысили показатели большинства стран G20 | 0 | 0 | 25-06-2025 |
| 9 | Эксперты назвали основные риски для роста российской экономики | 0 | 0 | 27-09-2019 |
